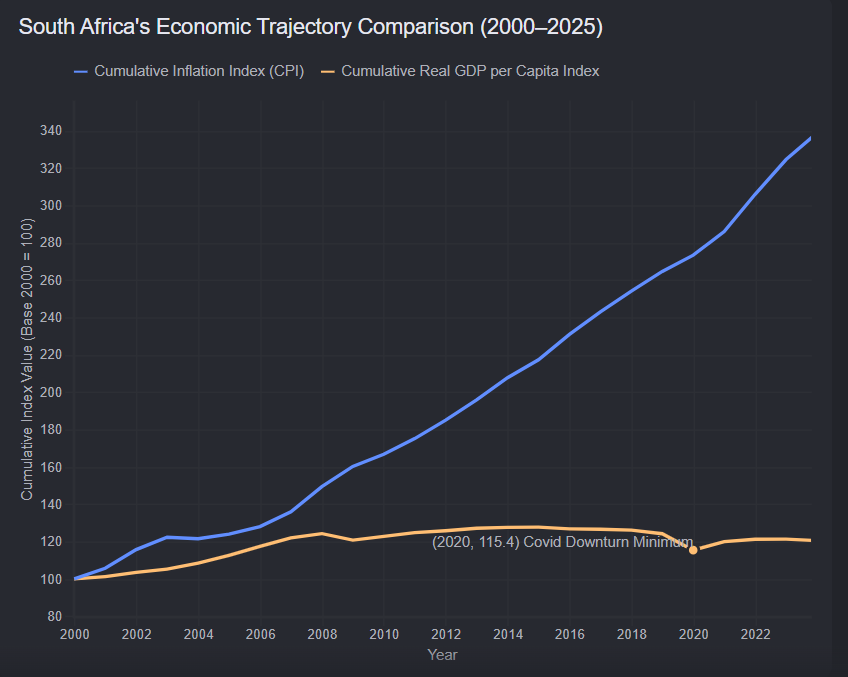
South Africa has been getting poorer. You can see in this chart that from 2000 to 2023, prices are 3.5x higher (inflation of 250%) but the GDP per capita only rose by 20%.

The Growth Trajectory: South Africa experienced a strong commodities-driven upward trend through the mid-2000s, peaking around 2008–2013. Since then, structural headwinds—including severe electricity constraints (load shedding) and logistical inefficiencies—have caused real GDP per capita to stagnate or slide backwards.

The 2020 Shocks: A notable drop-off can be observed in 2020 due to global pandemic disruptions, followed by a minor statistical rebound.

South Africa has been getting poorer. You can see in this chart that from 2000 to 2023, prices are 3.5x higher (inflation of 250%) but the GDP per capita only rose by 20%.

The Growth Trajectory: South Africa experienced a strong commodities-driven upward trend through the mid-2000s, peaking aroun...


1 0 reply

(by: Shabooya) (ID: 6016) Politics


×
required *
required *
reply file max size is 15MB* accepted file types are: jpg, jpeg, png, gif, mp4, mov, mp3*

Processing info ...
Reply